-
-
-
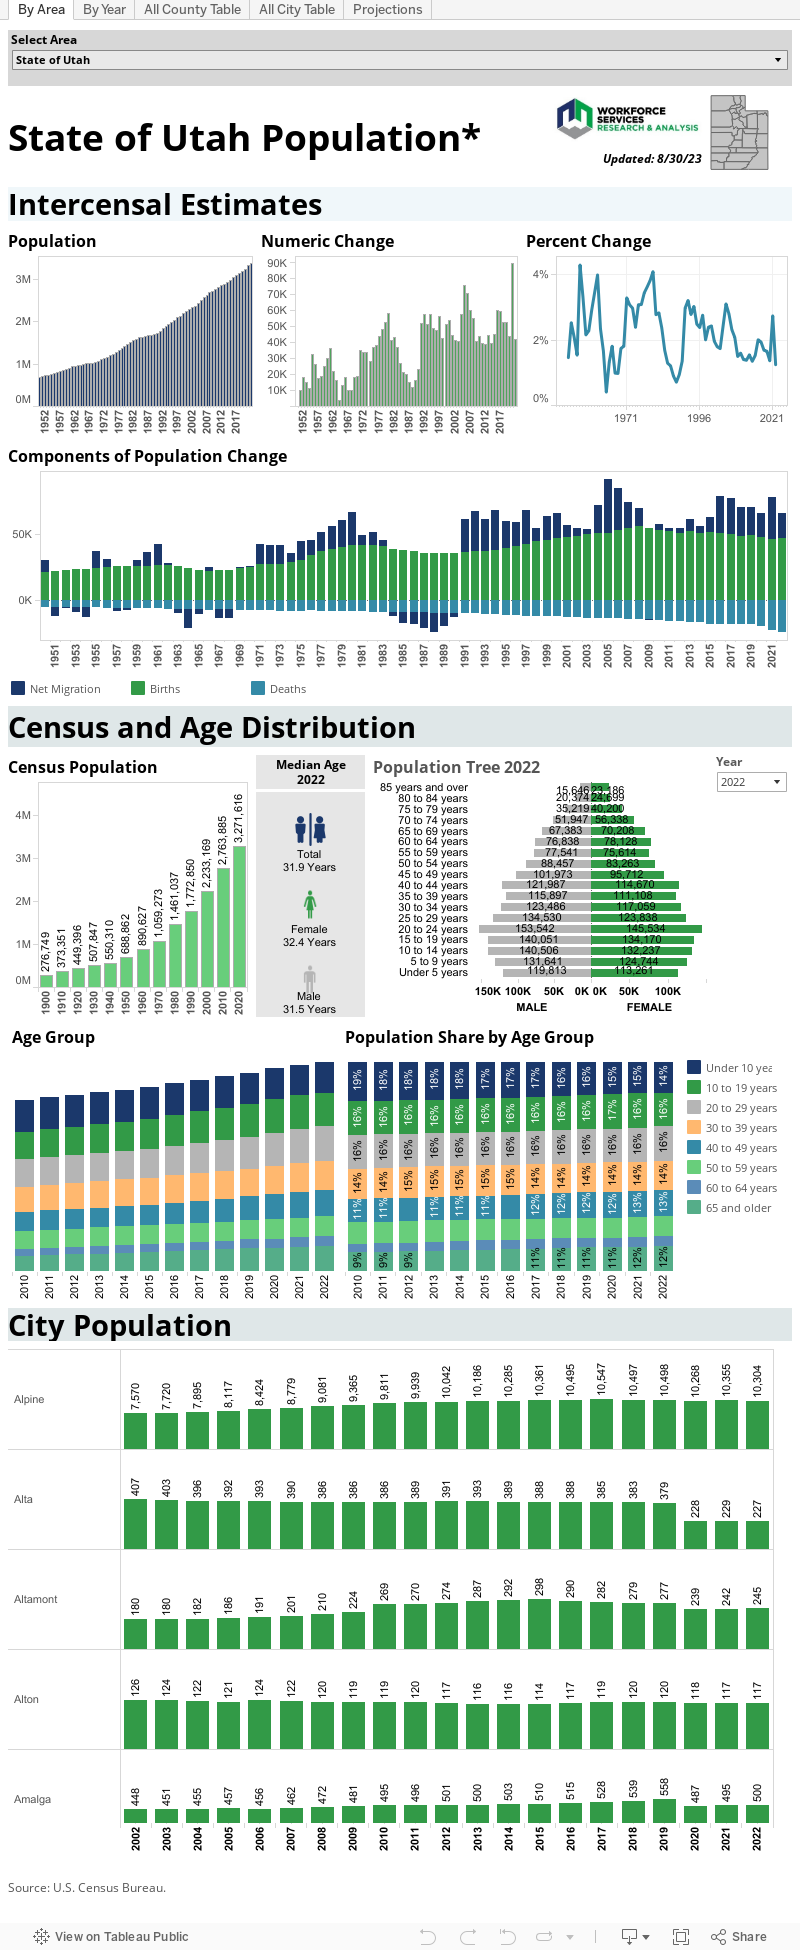
Detailed Population Profile
The U.S. Census Bureau only counts the United States population once every 10 years. In the intervening (intercensal) years, the Bureau uses other data sources to estimate population growth and contraction. This visualization provides yearly historical census counts and intercensal estimates (July 1) of the population for the state, counties and (when available) cities. In addition, components of population change and age group data are presented.
Directions: Change the selected area in the drop-down box at the top of the dashboard. Additional data points are available through the tab navigation above the visualization.
Related Link: Downloading Tableau Data