-
-
-
Moving on: Why Do Workers Move to Washington County?
Which comes first, jobs or workers?
By Lecia Parks Langston, Senior Economist
“The world is moved along, not only by the mighty shoves of its heroes, but also by the aggregate of tiny pushes of each honest worker.” Helen Keller
The Chicken or the Egg?
It’s a chicken and egg conundrum. Do workers move to Washington County for jobs and then enjoy the area or do they move to Washington County for the quality of life and then find a job? The answer to this question most likely lies somewhere in the middle — they do both. Short of an extensive and expensive survey, economists have been left with little concrete evidence of which reason predominates. However, analysis of recently developed job-to-job flow data suggests that a large portion of workers move to the St. George, UT MSA (Washington County) for nonmonetary reasons.The Job-to-Job Flows (J2J) data series, from the U.S. Census Bureau’s Local Employment Dynamics program, provides never-before-available information to help economists analyze the movement of workers. This article outlines what this new data set reveals about the workers who have moved to Washington County in recent years.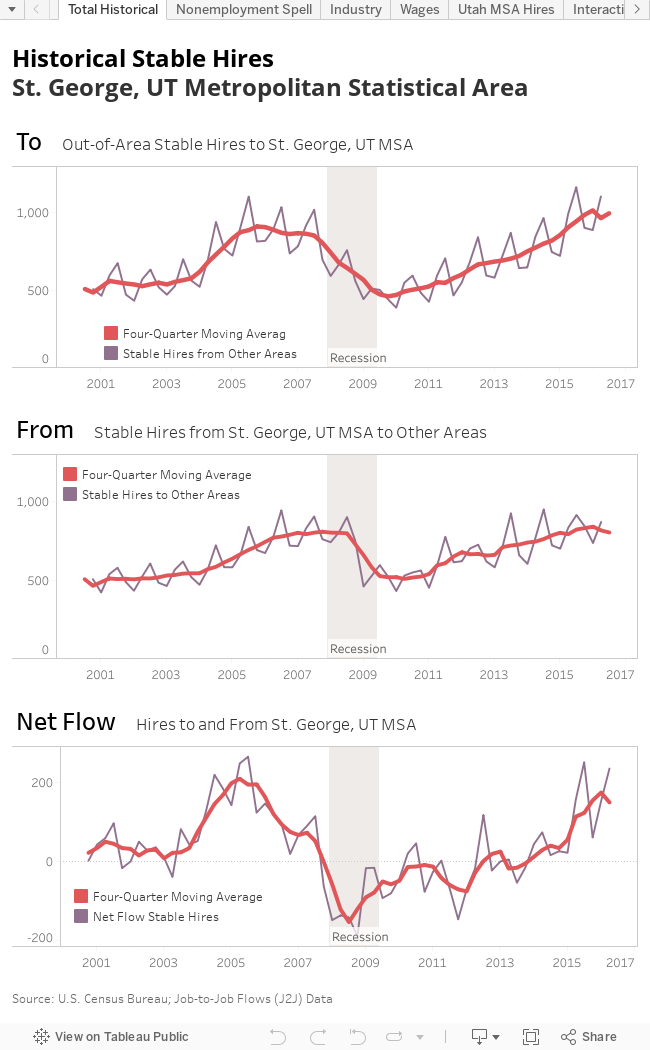
Quick Takeaways
- In Washington County, rapid population growth and robust job expansion go hand in hand.
- From 1970 to 2000, Washington County’s population almost doubled every decade, with employment growth reaching almost 20 percent in one year (1994).
- Job opportunities attract employees from other areas, but workers may also be motivated to move to the area for nonmonetary reasons.
- New data provides some clues to the employment or quality-of-life motivations of in-migrating workers.
- Between 2012 and 2016, roughly 15 percent of all Washington County in-migrants were age 65 or older.
- Another 25 percent were under the age of 18. In-migrants between the ages of 18 and 64, the typical working years, accounted for 60 percent of total move-ins.
- Those 65 years and older most likely moved to Washington County to take advantage of the quality of life and mild climate in the area.
- Workers both move from Washington County and to Washington County for employment purposes. The retail trade industry consistently hires the highest number of out-of-area workers, followed by healthcare/social assistance and accommodations/food services.
- Retail trade and accommodations/food services positions don’t pay particularly well and are plentiful in other areas.
- Since jobs in these industries are relatively low-paying and abundant elsewhere, it would appear that many workers prime purpose in moving to Washington County is not employment related.
- The healthcare and social assistance industry generally hires the second-highest number of out-of-state workers.
- Healthcare/social services pays 30 percent higher than the average Washington County wage and its wages are on par with salaries statewide.
- Out-of-state female workers are particularly prone to take healthcare/social assistance jobs.
- Despite the widespread availability of healthcare/social service positions nationwide, many workers may have moved to the county for these employment opportunities.
- Construction industry hiring of out-of-state workers ebbs and flows with the building cycle.
- Most workers moving to Washington County had a fairly short move.
- Roughly 65 percent came from other Utah counties, with the Las Vegas-Henderson-Paradise, NV MSA also providing a large number of workers.
- The larger metropolitan areas generally create far more employment opportunities, have lower unemployment and pay higher wages than Washington County, suggesting workers are moving to Washington County for quality of life upgrades.
- In contrast, for the 16-percent share of out-of-area workers moving from non-metro Utah, the ready availability of Washington County jobs may certainly be the driving force in obtaining Washington County employment.
- On an area-by-area basis, net flows of workers typically favor Washington County. The Las Vegas-Henderson-Paradise, NV MSA is often the exception to this rule.
- Washington County wages register much lower than the U.S. and Utah averages suggesting most nonurban in-migrators are not moving for a job with better wages.
- Out-of-area new hire wages also run consistently below the new hire wages of the large metro areas.
- Hire wages of out-of-state workers register lower than the hire wages of in-area workers, as well.
- The large differentials in hiring wages suggest that many workers in metro regions have nonmonetary reasons for moving house and job.
- In general, out-of-area workers taking jobs in wholesale trade, utilities, finance/insurance and healthcare/social services receive the highest wages.
- Workers moving to Washington County are most likely to be hired in the summer months and least likely to be hired in the winter months.
- In general, working in-migrants outnumber working out-migrants, although a downturn in the business cycle can supersede this relationship.
- During times of rapid expansion, in-migrant workers far outnumber those who leave Washington County for employment.
- Throughout the recession, Washington County experienced a net outflow of workers.
- The majority of out-of-area workers starting a job in Washington County either had a position before moving or shortly thereafter.
- The gap between the number of workers with continuous employment and those with a break proved much larger during economic expansions.
- Workers with continuous employment typically were hired at higher wages than those with discontinuous employment.
- The educational attainment of recent out-of-area worker hires (25 years and older) roughly mirrors the attainment of workers already in the county.
- Workers between the ages of 25 and 34 make up the largest share of out-of-area hires by age.
- While older workers still make up a relatively small share of out-of-area transplants, the oldest workers (55 and older) have steadily increased their share of total out-of-area hires since 2000.
- More out-of-area male hires are the norm, but the difference between male and female hires remains fairly close.
- Latino hires make up a fairly small share of out-of-area hires in Washington County; nevertheless, that share has been expanding, reflecting parallel population changes.
A Bit of Background
In the last four decades, Washington County has experienced some of the most rapid economic growth. That economic growth is obviously linked to its population growth. It wasn’t until the 1970s (when in-home air conditioning made summers in the southwest corner of the state bearable) that Washington County’s population and economy began to balloon. Between 1970 and 2000, the area‘s population almost doubled every decade. In tandem, employment skyrocketed.Even though large numbers of individuals continue to relocate to the area and the county’s number of residents has swelled, the rate of population growth has recently declined. With the exception of the Great Recession, Washington County residents have continued to increase at a higher-than-average rate. In fact, Washington County was just touted as the fastest growing MSA in the United States during 2017.The relationship between population growth and productivity growth is controversial. Nevertheless, population growth certainly drives labor force increases in Washington County. But, there is a synergistic effect between population and employment expansion. In-migration increases the demands for goods and services, which increases the demand for labor, which results in new in-migration and so on. Of course, the county’s strong tourism component creates job opportunities, as well.Employment expansion has certainly mimicked strong population growth. Washington County’s current job-growth rate (over 5 percent) is the equivalent of most other population-dense county’s employment expansions on steroids. In some pre-2000 boom years, employment generated amazing growth rates. For example, in 1985 and 1994, yearly nonfarm jobs skyrocketed by 16 and 19 percent respectively.The resultant hiring prospects certainly attract personnel. On the other hand, Washington County’s quality of life, mild climate, recreational opportunities and natural beauty also provide major enticements to those from other areas. These nonemployment temptations most certainly come into play for the relocating over-age-65 population. However, the motivation of in-migrating workers is far less assumable. Is it employment growth, or the quality of life, or (most likely) both that brings workers to Washington County? In the past, there’s been little data to definitively explain working-age relocations. The newly available data set — J2J — delivers information that suggests some answers.Who’s Moving In?
Who moves to Washington County? The Census Bureau’s American Community Survey (see the Washington County In-migrants visualization) reveals that almost one-fourth of those moving to Washington County in the last five years (2012-2016) are under the age of 18. Obviously, the majority of these young people are part of families relocating to the area. (The area’s strong presence of youth treatment homes also accounts for a portion of this in-migration.) On the other end of the age spectrum, 15 percent of in-migrants were 65 years of age and older. Right off the bat, nearly 40 percent of those who moved to Washington County were most likely moving for nonemployment purposes. Yet, they will demand the goods and services that create jobs.In addition, 19 percent of those transferring to the area were between the ages of 18 to 24 years, a notable portion of whom could be Dixie State University students, returning Latter-day Saints (Mormon) missionaries, or members of moving families. The remainder of in-migrants, roughly 44 percent, were categorized in the typical working-age group of 25 to 64 years. In other words, the majority of individuals who moved to Washington County in recent years were probably not motivated by reasons related to employment.New Job-to-Job Flows Data Series
But what about the working-age population; were they just enticed by the area’s rapid employment expansion? Additionally, what do we know about the workers moving to take a position in Washington County? It turns out we now know a great deal. The Census Bureau’s J2J data series tracks job hires and separations across the nation. When a worker changes their employment status, the data series can track whether they found new employment quickly, whether they just changed jobs, whether they went to work in a different industry or whether they took a job in another region.Also, J2J includes a variety of firm-level (age/size) and demographic statistics (gender/age/education/race-ethnicity) — although not all characteristics are available at all levels. This data set provides illuminating information on workers making job changes — in this particular case, workers moving in and out of the St. George, UT MSA (Washington County).The larger Local Employment Dynamics program (of which J2J is a subsection) has vividly exposed the fact that there is a tremendous amount of “churn” in the labor market. At least a portion of the workforce is frequently changing jobs or leaving/entering the labor market. The J2J data helps quantify and visualize that churn. For detailed information on the J2J data series, click here.Understanding Job-to-Job Flows Data
The J2J data used in this analysis tracks employment movements to and from MSAs. An MSA is a high-density population area with close economic ties and a central city or cities at its core. In addition, tabulations for the remaining non-MSA portion of a state are provided. The St. George, UT MSA is by definition Washington County. With a population of roughly 166,000 in 2017, the St. George, UT MSA is one of the country’s smaller metropolitan statistical areas.This origin/destination information from J2J does not include figures available in some of the more robust Local Employment Dynamics series. Hire data is limited to those who separated from their former job in the same quarter as they started their new job (“little or no nonemployment or continuous employment”), as well as those changing jobs between one adjacent quarter and another (“short spell of nonemployment”). For purposes of this research only, “stable” job hires are examined to avoid temporary and seasonal distortions. Stable hires represent new workers in jobs that lasted at least two additional quarters. Finally, J2J data is available starting in the year 2000.The Industry Factor
The hiring industry may provide the best evidence related to the motivations of in-migrating workers. If move-in employees are taking low-paying Washington County jobs that are also found abundantly in other areas, their behavior suggests that they are moving to improve their quality of life rather than because they need a job.Although out-of-area industry hires vary over time, retail trade consistently employs the highest number of out-of-area employees. In addition, accommodations/food services employs the third highest number of relocation workers. Over time, these two industries account for between 30 and 35 percent of all out-of-area workers. Neither of these industries pay particularly well nor even a high proportion of full-time positions. In fact, accommodations/food services ranks as the lowest-paying industry in Washington County.Even when the worker pool is restricted to those aged 25 to 64 years, retail trade is normally the industry with the most out-of-state hires. Even for this worker group, retail trade and accommodations/food services provide jobs for 25 to 30 percent new out-of-area hires. Since jobs in these industries are relatively low-paying and plentiful elsewhere, it would appear that many workers prime purpose in moving to Washington County is not employment related.On the other hand, healthcare and social assistance generally hires the second-highest number of out-of-state workers. In recent years, its share of hires has measured only slightly below that of retail trade. This industry can pay some occupations higher wages; although, they include a number of low-paying occupations, as well. While not the best-paying industry in the county, its wages register about 30 percent better than the average in the county comparable to healthcare/social services wages statewide.This industry’s share of out-of-area hires has risen from roughly 11 percent in 2000, to about 17 percent in 2015, a sign of the industry’s growing importance and an older-than-average population in Washington County. Of course, healthcare is a booming industry elsewhere and provides many opportunities in other regions. Yet, many of these relocating workers may have moved to Washington County with employment as a prime motivation.Out-of-state females are particularly prone to take a job in healthcare/social services in recent years. Roughly one-fourth of out-of-area women take a job in this industry. On the other hand, for out-of-area men, retail trade typically ranks has the top industry for hires. Construction is also a major generator of positions. During the building-driven boom leading up to the Great Recession, construction was the major industrial source for out-of-area male employment. Because of their wages, both construction and healthcare/social services jobs are much more likely to attract out-of-area workers for employment opportunities than does accommodations and retail trade.Where Did They Come From, Where Did They Go?
The source of in-migrating workers may also provide a clue to their reason for finding work in Washington County. While workers come to Washington County from all over the United States, most make a fairly short trek for these new jobs. The Salt Lake City, UT MSA provides more out-of-area workers to Washington County than any other MSA. Interestingly, the nonmetropolitan counties of Utah provide the second largest source of out-of-area workers, followed by the Provo-Orem, UT MSA, Ogden-Clearfield, UT MSA and Las Vegas-Henderson-Paradise, NV MSA. For out-of-area worker origination, honorable mentions go to the Los Angeles-Long Beach-Anaheim, CA MSA, Phoenix-Mesa-Scottsdale, AZ MSA, and Logan, UT-ID MSA. More than two-thirds of all out-of-area hires originated from these eight areas; and roughly 65 percent came from Utah.In general, Washington County gets more workers from these eight areas than it gives. However, the Las Vegas-Henderson-Paradise, NV MSA is often the exception to this rule. Interestingly, during the pre-recession boom, more workers left Washington County for the Provo-Orem, UT MSA than vice versa, as well. However, in recent months, Washington County has sent roughly the same number of workers to the Provo-Orem, UT MSA as it received.For the 16-percent share of out-of-area workers moving from non-metro Utah, the ready availability of Washington County jobs may certainly be the driving force in obtaining Washington County employment. Rural areas typically lag behind their metro counterparts in both employment opportunities and wages. Unemployment also tends to be more pronounced in Utah’s nonmetro regions.What about those moving from metropolitan areas? While Washington County’s jobs may typically (though not always) grow at a faster rate than its main sources of out-of-area workers, the metropolitan counties generally create far more employment opportunities. For example, the 2016 quarterly average of stable hires in the Salt Lake City, UT MSA equaled roughly 59,000 compared to just 6,200 in Washington County. Not only are positions more abundant in other Utah metro areas, jobless rates are generally lower than in Washington County. Only Weber County currently shows a (slightly) higher unemployment rate than does Washington County. This suggests factors beyond employment availability motivate metro-area workers to seek jobs in the southwest corner of the state.Factoring in Wages
In general, the breach between average wages in Washington County and cost-of-living is pronounced. Many workers may take a cut in buying power just by moving to Washington County. The area’s comparative cost-of-living (https://jobs.utah.gov/wi/data/library/wages/costofliving.html) index (97.9) suggests that living costs in St. George are almost equal to those in the average U.S. city and slightly higher than in most other metro areas (Ogden proving the exception).In contrast, Washington County wages register much lower than the U.S. and Utah averages. In 2016, the average Washington County nonfarm wage measured 76 percent of the comparable Utah figure. The contrast between Salt Lake County (the source of the highest number of worker in-migrants) and Washington County wages is even more dire — Washington’s average wage measures 67 percent of that of Salt Lake County.New hire wages also run lower in Washington County than in every other major metro contributor with the exception of the Logan, UT MSA. The dissimilarities in hiring wages between Washington County and the Salt Lake City, UT MSA are particularly large. The average monthly new hire wage in Salt Lake County for 2016 measured $2,600 compared to less than $1,900 in Washington County. It is unlikely that most workers come out ahead monetarily by making a job move to Washington County. The large differentials in hiring wages suggest that many workers in metro regions have nonmonetary reasons for moving house and job.Moreover, out-of-area new hire wages run consistently below the wages of all new hires in Washington County. Because out-of-area hires represent a relatively small subset of total hires, wage trends can be somewhat erratic. However, new hires from other areas generally run 20 to 30 percent below stable hires of all workers. Those in-migrating workers with virtually continuous employment also demand higher wages than those with a brief spell of nonemployment.While most industries show a hiring wage gap between in-area and out-of-area hires, several do not. Wholesale trade, utilities, finance/insurance, healthcare/social services, mining and professional/scientific/technical services show little difference in the wages of local hires and in-migrant hires. These industries also typically offer the highest hire wages to in-migrants.Tis the Season
What else can we learn about in-migrating workers? A quick examination of historical J2J hires to- and- from Washington County reveals a decided seasonal pattern. Out-of-area workers taking jobs in Washington County are most likely to be hired in the summer months (third calendar quarter). And, they are least likely to make a job move to the county in the first quarter. Interestingly, Washington County workers moving to jobs outside the area show similar seasonal patterns. Summer is the typical time to change jobs, especially for parents with school-age children; winter is the time to stay put. Moreover, seasonal summer-job availability undoubtedly provides some impetus to change jobs and living areas.However, when net flows are examined — the difference between out-of-area hires to Washington County and out-of-area hires from Washington County — inflow generally wins. More out-of-area workers are hired in Washington County than leave the county for employment in the summer months. Nevertheless, the business cycle can quickly override this relationship.Cycling Through
The effect of boom and bust is obvious on out-of-area hiring. During the 2004-to-2006 business-cycle upswing, out-of-area hires surged. Washington County hires of out-of-area workers peaked in the third quarter of 2005 at roughly 1,100. However, during those years, Washington County workers also moved to out-of-area jobs at a higher-than-normal rate. Yet, at the height of the boom, a much larger number of workers were moving to Washington County jobs than leaving.Enter the recession. Not only did the number of out-of-area hires plummet, but a conspicuously greater number of Washington County workers left for greener employment pastures. This meant the net flow rotated in favor of workers exiting the county. At their worst, net worker outflows in first quarter 2008 measured 190 positions per quarter. This condition continued for several years after the recession ended. At the lowest level in first quarter 2010, Washington County hires of out-of-area workers measured less than 390. It wasn’t until the county’s labor market was firmly back on its feet in 2014 that a comparatively higher number of workers started moving into the region than leaving it.A Fast Break?
The J2J data series for MSAs provides breakouts of destination hires based upon whether employees moved directly from one job to another with little-to-no nonemployment between jobs (i.e., continuous employment), or separated from their prior main job in the preceding quarter (brief spell of nonemployment). Longer lengths of nonemployment are not available.Since 2000, the majority of out-of-area workers starting a job in Washington County were most likely to have left their previous employment within the quarter (continuous employment). In other words, most in-migrating workers either had a new job before they came to Washington County or immediately found a new position upon relocating. The number of out-of-area hires with a brief period of nonemployment registered consistently lower than hires with “continuous” employment. During expansionary periods when jobs are plentiful, workers making a seamless employment change far, far outnumbered those with a brief nonemployment period. During the downturn, the gap narrowed substantially.Those with a continuous employment history also, on average, demanded higher wages than did workers with a period of nonemployment. In recent years, the wage gap between the two groups has increased dramatically.Education
The educational attainment of recent out-of-area worker hires (those 25 and older) roughly mirrors that of workers already in the county. About 15 percent have less than a high school education, 30 percent have graduated from high school, one-third have some college or an associate degree and about 20 percent have a bachelor’s degree or higher. These shares, however, have modulated over time. In recent years, a higher proportion of workers moving in (15 percent) have less than a high school education than in 2000 (9 percent). On the other hand, the share of out-of-area workers with some college or an associate degree has declined somewhat. The other two educational-attainment group shares have remained relatively steady.Those with a bachelor’s degree or higher were much more likely to take a job in healthcare/social services and educational services than their less-educated peers. However, a fair number still found employment in the retail trade sector. Out-of-area workers with some college or an associate degree were also more likely to take a healthcare/social services position. Not surprisingly, those with less than a high school education were most likely to be hired in retail trade, construction and accommodations/food services. However, many with less than a high school education also found employment in healthcare/social services.Age
Workers between the ages of 25 and 34 make up the largest share of out-of-area hires by age. Employees in this age bracket are less likely to be entrenched in a career. Next in the hiring line comes the subsequent age group of 35-44 years. Younger workers do seem to be more susceptible to the influence of the hiring fluctuations of the business cycle.Over time, the youngest workers — those between the ages of 14 and 21 — have comprised a smaller and smaller share of out-of-area hires. This pattern reflects the lower overall labor force participation of this age group in the past two decades and appears in other labor force demographics.Interestingly, while they still make up a relatively small share of out-of-area transplants, the oldest workers (55 and older) have steadily increased their share of total out-of-area hires since 2000. This undoubtedly reflects the aging baby boom generation performing its “pig in the python” demographic trick.Gender
While more out-of-area male hires are the norm, the difference between male and female hires remains fairly close. Men typically account for 55-58 percent of stable out-of-area hires. The gap is widest during strong expansionary periods when construction employment (a male dominated field) is increasing rapidly. The smallest gap in male/female hires occurred at the end of the recession before growth took hold.As mentioned in the industrial section, women are most likely to be hired in the health/social services industry. Move-in males find the most employment in construction and retail trade.Ethnicity
The U.S. Census Bureau tracks only one major ethnic group — Hispanic or Latino. If an individual considers themselves to be of Cuban, Mexican, Puerto Rican, South or Central American, or other Spanish culture, then they are included in the Census Bureau’s Hispanic or Latino ethnic group. People categorized as Hispanic or Latino can be of any racial group.While Latino hires make up a fairly small share of out-of-area hires in Washington County, that share has been expanding. This trend reflects demographic changes in the overall population. In 2000, less than 7 percent of out-of-area hires were Hispanic/Latino compared to nearly 15 percent in 2016. Surges in out-of-area Latino hires tend to coincide with strong employment expansion in the county.Race
Those visiting Washington County may see a sea of white faces because the area is not particularly diverse. That holds true for those relocation hires to the area, as well. In 2016, whites accounted for roughly 91 percent of total out-of-area hires. However, Washington County is slowly becoming more racially varied. In 2000, white out-of-area hires measured 95 percent of the total compared to 91 percent in 2016. Currently, Native Americans, African Americans and Asians comprise almost equal shares (2 percent each) of out-of-area hires. Interestingly, during the Great Recession, nonwhites conspicuously increased their share of out-of-area hires.Quality of Life or Employment Opportunity?
While the data cannot precisely specify what share of workers move for employment or quality of life issues, it appears that a notable proportion of out-of-area workers move for nonemployment-related reasons. The high hire rates in low-paying industries with abundant jobs, the high worker contribution rates of large MSAs with higher paying jobs and plentiful employment opportunities suggest that many workers move for an improved quality of life.